Centralized Analytics Dashboard

Real-time insights, smart automation, and complete control—right from your screen.

Dashboard Analytics Devices Reports Settings Growave Energy Dashboard Current Usage 4.2 kWh Occupancy 12 Zones Savings ₹12,450 Energy Consumption Trend Mon Tue Wed Thu Fri Sat Sun This Week Last Week

Analytics Dashboard Overview

The Growave Analytics Dashboard is your centralized hub to monitor, analyze, and manage energy consumption across your facility. Designed for institutions and industries, it delivers AI-powered insights, device-level control, and occupancy-aware automation—all within an intuitive, responsive web interface accessible from any device.

Core Features of the Dashboard

Comprehensive tools to optimize your energy usage and maintain peak efficiency.

Live Energy Monitoring

  • Real-time data on electricity usage per room/zone
  • Active vs. idle appliance status
  • Consumption comparison by day/week/month
Mon Tue Wed Thu Fri

Occupancy & Environment Analytics

  • Live indicator of human presence using mmWave radar
  • Temperature, humidity, light intensity, and CO₂ level overlays
  • Smart graphs for quick understanding
12
People
24°C
Temp
450
CO₂ ppm

Device Control & Manual Override

  • Toggle fans, lights, ACs, or custom-named appliances in each zone
  • Additional manual-control relays for devices beyond fans/lights/ACs
  • Individual appliance control with name-labeling
Conference Room Lights
Office AC Unit
Lobby Fans

Smart Alerts & Recommendations

  • Notification when appliances are running in empty spaces
  • Suggestions to turn off unnecessary equipment
  • "Click to Turn Off All" or "Schedule Auto-Off" buttons
  • Email/SMS/WhatsApp push alerts for quick access

Energy Waste Alert

Conference Room B lights and AC have been running for 2 hours with no occupancy.

Modes of Operation Control Panel

  • 🟢 Smart Mode (AI-managed)
  • 🟡 Priority Mode (minimal energy use)
  • 🔴 Hyper Mode (full manual override or event mode)
  • Auto-reset timers and customizable logic
Smart
Priority
Hyper
Currently in Smart Mode: AI optimizing energy based on occupancy patterns

Water Management Interface

  • Water tank level (with ultrasonic integration)
  • Smart irrigation timing (with soil moisture input)
  • Leak detection alerts and water wastage report
70%
Tank Level
Zone 3
Irrigation Active

Analytics & Reports

  • Daily/weekly/monthly usage reports
  • Cost savings calculator
  • Graphs for zone-wise efficiency & appliance-wise performance
Monthly Savings ₹12,450
vs. Target: ₹18,000 70%

Custom Configuration Tools

  • Rename devices, assign zones, set occupancy delay logic
  • Create schedules or link to motion detection triggers
  • Configure notification preferences (email, SMS, WhatsApp)
Zone Configuration Advanced

User Access Control & Firmware Updates

  • Admin login only with activity logs
  • Monitor controller health and firmware version
  • Trigger OTA (Over-the-Air) updates
  • Receive hardware diagnostic alerts for sensor errors
System Status: Online
Healthy
Firmware Version: v2.4.1
Last Update: 2 days ago
Connected Devices: 24

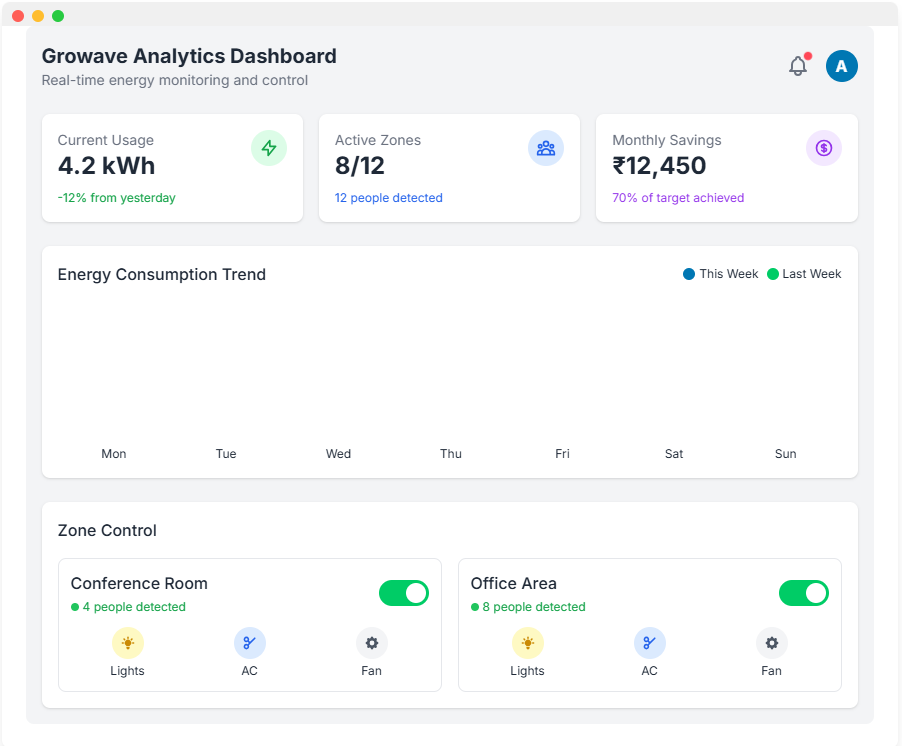
See the Dashboard in Action

Experience how our centralized analytics platform transforms your energy management.

Growave Analytics Dashboard Preview

Experience the full power of our analytics dashboard with a personalized demo.

Request a Demo

Ready to Optimize Your Energy Management?

Our Centralized Analytics Dashboard gives you complete control and visibility over your energy usage.

Get in Touch

Interested in our Centralized Analytics Dashboard? Contact us for more information or to schedule a demo.

Send Us a Message

Contact Information

Address

Warulwadi, Narayangaon District
Pune, Maharashtra 410504

Email

info@growavesolutions.com

Phone

+91 82755 63155

+91 99752 60214

+91 99220 26825

WhatsApp Now

Chat on WhatsApp

Business Hours

  • Monday - Friday: 9:00 AM - 6:00 PM
  • Saturday: 10:00 AM - 2:00 PM
  • Sunday: Closed